Master Tableau Desktop-Certified-Associate Exam with Reliable Practice Questions
In your view, you are using a background image. How can you find the X and Y coordinates on your image?
Correct : B
https://help.tableau.com/current/pro/desktop/enus/
bkimages_coordinates.htm#:~:text=Right%2Dclick%20anywhere%20on%20the,Annotation
%20dialog%20box%2C%20click%20OK.
Start a Discussions
Using the metadata grid, you can rename the remote fields.
Correct : B
We can rename the field from the metadata grid, but not the remote fields.
Remote field cannot be renamed by any means from Tableau
Start a Discussions
Connect to the "Education" data source. Analyze the Math score and create 3 categories. If the score is less than 500 then consider the student as 'Low Performer'. If the score is greater than or equal to 500 but less than 600 then call it 'Average Performer'. If the score is greater than or equal to 600 then 'High Performer'. Find out the percentage of Average Performers in males?
Correct : D
Create the Calculated field 'Math Performers':
Drop the Math Performer field to the Rows and drop gender to filter, select 'Men'
Drop the Number of Records (if tableau version prior to 2020.2) to the Text
Or
Drop the Education.csv(Count) (tableau version 2020.2 and after) to the Text
Apply 'Percent of Total' Quick table calculation to the field on the Text marks card:
Start a Discussions
You have connected to an excel sheet that has two tables "orders" and "returns". You need to create a data extract and store it as Multiple Tables. But multiple tables option is greyed out. What is the possible reason for this?
Correct : B
Select the Extract connection and click on Edit as shown:
If you have single table on the canvas, then Multiple tables option remain disabled:
If you create a join, only then Multiple tables option will be enabled:
Start a Discussions
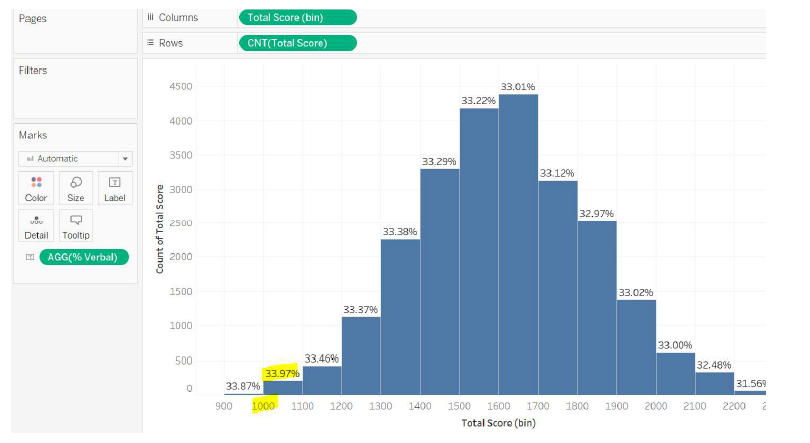
Connect to the "Education" data source. Create a histogram using the Total score field and having a bin size of 100. Find out in which bin the students scored the highest verbal percentage? [Note: Verbal percentage should be calculated by considering how many marks scored in the verbal out of the total marks scored.]
Correct : B
Create a calculated field to compute the contribution of verbal marks in percentage:
Select the Total Score field and using Show me create a histogram.
Edit the Total Score(bin) and provide the Size of bins as 100:
Drop the % Verbal field to the Label, your view will look like this:

Start a Discussions