Master Fortinet FCP_FAZ_AN-7.4 Exam with Reliable Practice Questions
When managing incidents on FortiAnlyzer, what must an analyst be aware of?
Correct : A
In FortiAnalyzer's incident management system, analysts have the option to manually manage incidents, which includes attaching relevant reports to an incident for further investigation and documentation. This feature allows analysts to consolidate information, such as detailed reports on suspicious activity, into an incident record, providing a comprehensive view for incident response.
Let's review the other options to clarify why they are incorrect:
Option A: You can manually attach generated reports to incidents
This is correct. FortiAnalyzer allows analysts to manually attach reports to incidents, which is beneficial for providing additional context, evidence, or analysis related to the incident. This functionality is part of the incident management process and helps streamline information for tracking and resolution.
Option B: The status of the incident is always linked to the status of the attached event
This is incorrect. The status of an incident on FortiAnalyzer is managed independently of the status of any attached events. An incident can contain multiple events, each with different statuses, but the incident itself is tracked separately.
Option C: Severity incidents rated with the level High have an initial service-level agreement (SLA) response time of 1 hour
This is incorrect. While incidents have severity levels, specific SLA response times are typically set according to the organization's incident response policy, and FortiAnalyzer does not impose a default SLA response time of 1 hour for high-severity incidents.
Option D: Incidents must be acknowledged before they can be analyzed
This is incorrect. Incidents on FortiAnalyzer can be analyzed even if they are not yet acknowledged. Acknowledging an incident is often part of the workflow to mark it as being actively addressed, but it is not a prerequisite for analysis.
Start a Discussions
Why must you wait for several minutes before you run a playbook that you just created?
Correct : A
When a new playbook is created on FortiAnalyzer, the system requires some time to parse and validate the playbook before it can be executed. Parsing involves checking the playbook's structure, ensuring that all syntax and logic are correct, and preparing the playbook for execution within FortiAnalyzer's automation engine. This initial parsing step is necessary for FortiAnalyzer to load the playbook into its operational environment correctly.
Here's why the other options are incorrect:
Option A: FortiAnalyzer needs that time to parse the new playbook
This is correct. The delay is due to the parsing and setup process required to prepare the new playbook for execution. FortiAnalyzer's automation engine checks for any issues or dependencies within the playbook, ensuring that it can run without errors.
Option B: FortiAnalyzer needs that time to debug the new playbook
This is incorrect. Debugging is not an automatic process that FortiAnalyzer undertakes after playbook creation. Debugging, if necessary, is a manual task performed by the administrator if there are issues with the playbook execution.
Option C: FortiAnalyzer needs that time to back up the current playbooks
This is incorrect. FortiAnalyzer does not automatically back up playbooks every time a new one is created. Backups of configuration and playbooks are typically scheduled as part of routine maintenance and are not triggered by playbook creation.
Option D: FortiAnalyzer needs that time to ensure there are no other playbooks running
This is incorrect. FortiAnalyzer can manage multiple playbooks running simultaneously, so it does not require waiting for other playbooks to finish before initiating a new one. The waiting time specifically relates to the parsing process of the newly created playbook.
Start a Discussions
Exhibit.

What can you conclude about the output?
Correct : A
In this output, we see two diagnostic commands executed on a FortiAnalyzer device:
diagnose fortilogd lograte: This command shows the rate at which logs are being processed by the FortiAnalyzer in terms of log entries per second.
diagnose fortilogd msgrate: This command displays the message rate, or the rate at which individual messages are being processed.
The values provided in the exhibit output show:
Log rate (lograte): Consistently high, showing values such as 70.0, 132.1, and 133.3 logs per second over different time intervals.
Message rate (msgrate): Lower values, around 1.4 to 1.6 messages per second.
Explanation
Interpretation of log rate vs. message rate: In FortiAnalyzer, the log rate typically refers to the rate of logs being stored or indexed, while the message rate refers to individual messages within these logs. Given that a single log entry can contain multiple messages, it's common to see a lower message rate relative to the log rate.
Understanding normal operation: In this case, the message rate being lower than the log rate is expected and typical behavior. This discrepancy can arise because each log entry may bundle multiple related messages, reducing the message rate relative to the log rate.
Conclusion
Correct Answe r : A. The message rate being lower than the log rate is normal.
This aligns with the normal operational behavior of FortiAnalyzer in processing logs and messages.
There is no indication that both logs and messages are nearly finished indexing, as that would typically show diminishing rates toward zero, which is not the case here. Additionally, there's no information in this output about specific ADOMs or a comparison between traffic logs and event logs. Thus, options B, C, and D are incorrect.
FortiOS 7.4.1 and FortiAnalyzer 7.4.1 command guides for diagnose fortilogd lograte and diagnose fortilogd msgrate.
Start a Discussions
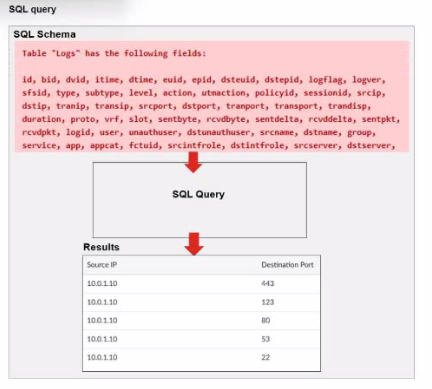
Exhibit.

A fortiAnalyzer analyst is customizing a SQL query to use in a report.
Which SQL query should the analyst run to get the expected results?
A)

B)

C)

D)

Correct : A
The requirement here is to construct a SQL query that retrieves logs with specific fields, namely 'Source IP' and 'Destination Port,' for entries where the source IP address matches 10.0.1.10. The correct syntax is essential for selecting, filtering, ordering, and grouping the results as shown in the expected outcome.
Analysis of the Options:
Option A Explanation:
SELECT srcip AS 'Source IP', dstport AS 'Destination Port': This syntax selects srcip and dstport, renaming them to 'Source IP' and 'Destination Port' respectively in the output.
FROM $log: Specifies the log table as the data source.
WHERE $filter AND srcip = '10.0.1.10': This line filters logs to only include entries with srcip equal to 10.0.1.10.
ORDER BY dstport DESC: Orders the results in descending order by dstport.
GROUP BY srcip, dstport: Groups results by srcip and dstport, which is valid SQL syntax.
This option meets all the requirements to get the expected results accurately.
Option B Explanation:
WHERE $filter AND Source IP != '10.0.1.10': Uses != instead of =. This would exclude logs from the specified IP 10.0.1.10, which is contrary to the expected result.
Option C Explanation:
The ORDER BY clause appears before the FROM clause, which is incorrect syntax. SQL requires the FROM clause to follow the SELECT clause directly.
Option D Explanation:
The GROUP BY clause should follow the FROM clause. However, here, it's located after WHERE, making it syntactically incorrect.
Conclusion:
Correct Answe r : A. Option A
This option aligns perfectly with standard SQL syntax and filters correctly for srcip = '10.0.1.10', while ordering and grouping as required.
FortiAnalyzer 7.4.1 SQL query capabilities and syntax for report customization.
Start a Discussions
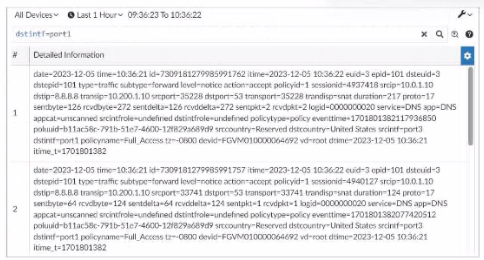
Exhibit.

What can you conclude about these search results? (Choose two.)
Correct : A, D
In this exhibit, we observe a search query on the FortiAnalyzer interface displaying log data with details about the connection events, including fields like date, srcip, dstip, service, and dstintf. This setup allows for several functionalities within FortiAnalyzer.
Option A - Download Capability:
FortiAnalyzer provides the option to download search results and reports to a file in multiple formats, such as CSV or PDF, allowing for further offline analysis or archival. This makes it possible to save the search results shown in the exhibit to a file.
Conclusion: Correct.
Option B - Sorting and Customization:
The FortiAnalyzer interface allows users to sort and customize columns for search results. This helps in organizing and viewing the logs in a manner that fits the analyst's needs, such as ordering logs by time, srcip, dstip, or other fields.
Conclusion: Correct.
Option C - Availability in FortiView:
FortiView is a tool within FortiAnalyzer that visualizes data and provides analysis capabilities, including traffic and security event logs. Since these are traffic logs, they are typically available for visualization and analysis within FortiView.
Conclusion: Incorrect.
Option D - Text Mode Search:
The search displayed here appears to be in a structured format, which implies it might be utilizing filters rather than a free-text search. FortiAnalyzer allows both structured searches and text searches, but there's no indication here that text mode was used.
Conclusion: Incorrect.
Conclusion:
Correct Answe r : A. They can be downloaded to a file. and B. They are sortable by columns and customizable.
These options are consistent with FortiAnalyzer's capabilities for managing, exporting, and customizing log data.
FortiAnalyzer 7.4.1 documentation on search, export functionalities, and customizable views.
Start a Discussions