Master Cisco 500-420 Exam with Reliable Practice Questions
A team of developers deploys new Java servlet code that should create new business transactions in AppDynamics. After applying load on the new code function, there are no new Business Transactions on the Business Transaction Dashboard. Which two options should the developers check in AppDynamics to make sure the Business Transactions can be discovered?
[Choose two.)
Correct : B, E
When new business transactions are not appearing on the Business Transaction Dashboard after deploying new code, developers should verify that there are no exclusion rules in place on the tier where the new code was deployed. Additionally, it is crucial to ensure that the Auto Discovery feature for servlets is enabled for Java agents, as this allows AppDynamics to automatically detect and name business transactions based on incoming requests to servlets. Both of these checks are necessary to ensure that new business transactions can be discovered and monitored. Reference: AppDynamics documentation on Business Transaction detection and Java Agent configuration.
Start a Discussions
Refer to exhibit.

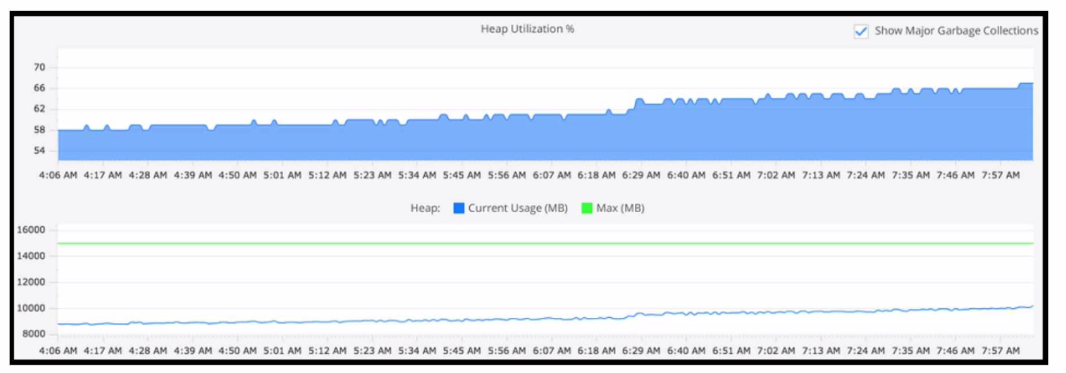
Refer to the exhibit. Using this heap utilization graph, which method is used to confirm if a memory leak is occurring during a certain time frame?
Correct : B
To confirm if a memory leak is occurring, one should refer to the Tiers and Nodes section of the AppDynamics Controller UI, navigate to the Memory tab, and observe the Heap Utilization over time in relation to the Heap's Current Usage (MB) versus the Maximum (MB) allocated. Consistent growth in heap utilization or an upward trend that does not decrement even after garbage collection indicates a potential memory leak.
Start a Discussions
Which three data points can be located by drilling down into a JDBC exit call for an Oracle backend? (Choose three.)
Correct : A, B, E
When drilling down into a JDBC exit call for an Oracle backend, AppDynamics provides detailed information about the call. The data points include:
Query type, which can indicate whether it's a SELECT, INSERT, UPDATE, or DELETE statement.
Statement type, which describes the nature of the SQL statement being executed.
Originating node, which identifies the node from which the JDBC call originated.
These data points help in understanding the nature and source of database operations, which can be critical for performance analysis and troubleshooting.
AppDynamics documentation on Database Monitoring:
Start a Discussions
Refer to exihibit.

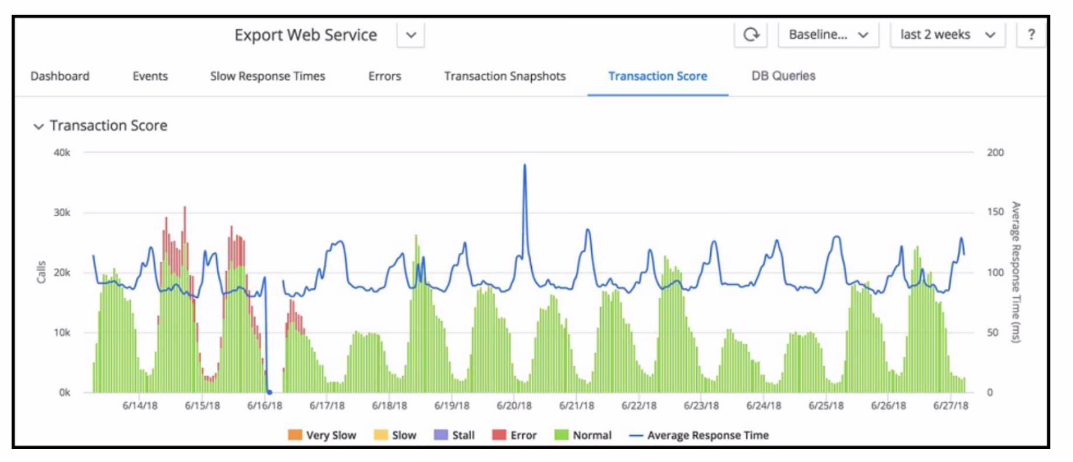
Refer to the exhibit. When looking at the Transaction Score for a specific transaction, how are errors in the transaction identified?
Correct : A
Errors in a transaction are identified by examining the snapshots that capture the problematic transactions. By setting the appropriate time range, a Performance Analyst can drill down into the snapshots within the Error tab to identify and analyze errors. These snapshots provide detailed diagnostic information, such as stack traces, slow SQL queries, and error logs, which are vital for pinpointing the root cause of transaction errors.
AppDynamics documentation on Transaction Snapshots:
Start a Discussions
What is the Node limit of the maximum Service Endpoints per node?
Correct : B
AppDynamics imposes a limit on the number of Service Endpoints that can be registered per node to ensure manageable performance and overhead. The limit per node is set to 100 Service Endpoints, which is a balance between providing detailed monitoring and maintaining application performance.
AppDynamics documentation on Service Endpoints: https://docs.appdynamics.com/latest/en/application-monitoring/monitor-service-endpoints
Start a Discussions