Master Adobe AD0-E208 Exam with Reliable Practice Questions
A UI/UX manager asks an analyst to create an Analysis workspace visualization that shows all visits to English (/En) pages. The workspace is accessible by multiple stakeholders, most of whom have edit access.
Which visualization approach would be used?
Correct : B
The best way to create an Analysis Workspace visualization that shows all visits to English (/en) pages is to create a Freeform Table with Page Name and Visits, and then apply a filter to Page Name by ''contains = /en''. This will ensure that only the pages that have ''/en'' in their name will be shown in the table, regardless of their position in the URL. Filtering by ''ends with = /en'' would exclude pages that have other parameters after ''/en'', and dragging and dropping all Page Names that contain ''/en'' would be tedious and prone to errors.
References: https://experienceleague.adobe.com/docs/analytics/analyze/analysis-workspace/build/freeform-tables.html?lang=en https://experienceleague.adobe.com/docs/analytics/analyze/analysis-workspace/build/freeform-tables.html?lang=en#filtering-data-in-a-freeform-table
Start a Discussions
A chart displaying the daily trend of Orders and their performance against the daily average for the last month is needed.
How can this requirement be met?
Correct : A
The best way to display the daily trend of Orders and their performance against the daily average for the last month is to use a Line Visualization to trend the Orders and the daily average as a Calculated Metric in the same chart. A Calculated Metric can be created by using the Average function on Orders and applying a date range of last month. A Line Visualization can show both metrics as lines on the same chart, allowing for easy comparison.
References: https://experienceleague.adobe.com/docs/analytics/analyze/analysis-workspace/calculated-metrics/calculated-metrics-overview.html?lang=en https://experienceleague.adobe.com/docs/analytics/analyze/analysis-workspace/calculated-metrics/calculated-metrics-overview.html?lang=en#creating-a-calculated-metric https://experienceleague.adobe.com/docs/analytics/analyze/analysis-workspace/visualizations/line-visualization.html?lang=en
Start a Discussions
An analyst is given a list of specific events a user must take to complete a purchase. What would be used to see the conversion rate between steps?
Correct : B
A Fallout Visualization is a tool that shows the conversion rate between steps or touchpoints in a user journey. It can help identify where users drop off or complete a goal, such as a purchase. It can also support different types of touchpoints, such as pages, events, segments, or dimensions.
References: https://experienceleague.adobe.com/docs/analytics/analyze/analysis-workspace/visualizations/fallout.html?lang=en https://experienceleague.adobe.com/docs/analytics/analyze/analysis-workspace/visualizations/fallout.html?lang=en#creating-a-fallout-visualization
Start a Discussions
What is a valid use of a segment as a touchpoint in a Fallout Visualization?
Correct : B
A valid use of a segment as a touchpoint in a Fallout Visualization is to use a visit-based segment as a touchpoint inside a visit-context Fallout Visualization. This means that the segment will apply to the entire visit and the fallout will show the conversion within the same visit. Using a visitor-based segment as a touchpoint inside a visit-context Fallout Visualization or using a visit-based segment as a touchpoint inside a visitor-context Fallout Visualization are not valid uses, as they will cause mismatched scopes and inaccurate results.
References: https://experienceleague.adobe.com/docs/analytics/analyze/analysis-workspace/visualizations/fallout.html?lang=en#segment-touchpoints https://experienceleague.adobe.com/docs/analytics/analyze/analysis-workspace/visualizations/fallout.html?lang=en#fallout-visualization-scopes
Start a Discussions
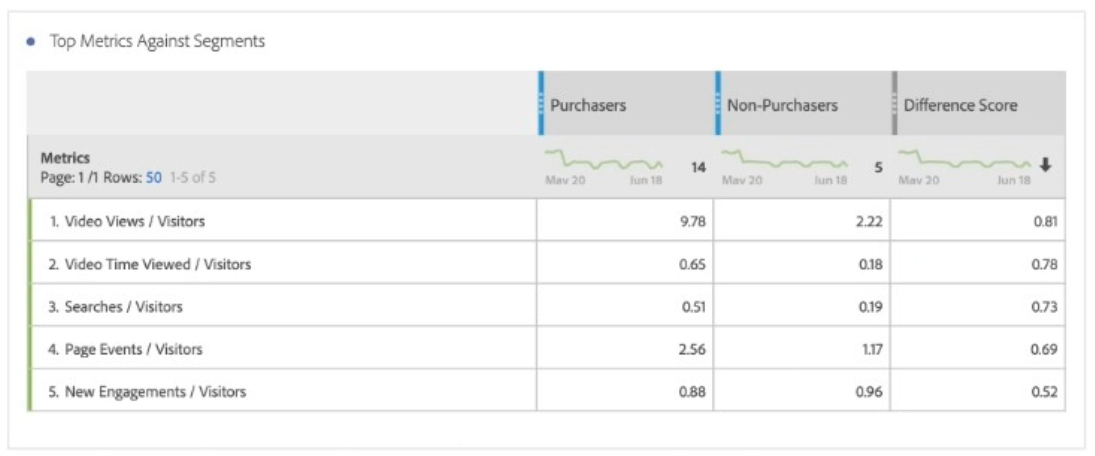
Refer to the exhibit:

What is a valid interpretation of this Segment Comparison between Purchasers and Non-Purchasers segments?
Correct : B
A valid interpretation of this Segment Comparison between Purchasers and Non-Purchasers segments is that on average, Purchasers view 81 % more videos than Non-Purchasers. This means that the average Video Views per Visitor for Purchasers is 81 % higher than that for Non-Purchasers. Video Views/Visitors is not the most statistically significant difference between the two segments, as it has a low confidence level of 68 %. Purchasers are not 81 % more likely to complete a Video View than Non-Purchasers, as this would imply a probability or conversion rate, not an average.
References: https://experienceleague.adobe.com/docs/analytics/analyze/analysis-workspace/components/segment-comparison.html?lang=en https://experienceleague.adobe.com/docs/analytics/analyze/analysis-workspace/components/segment-comparison.html?lang=en#interpreting-segment-comparison-results
Start a Discussions